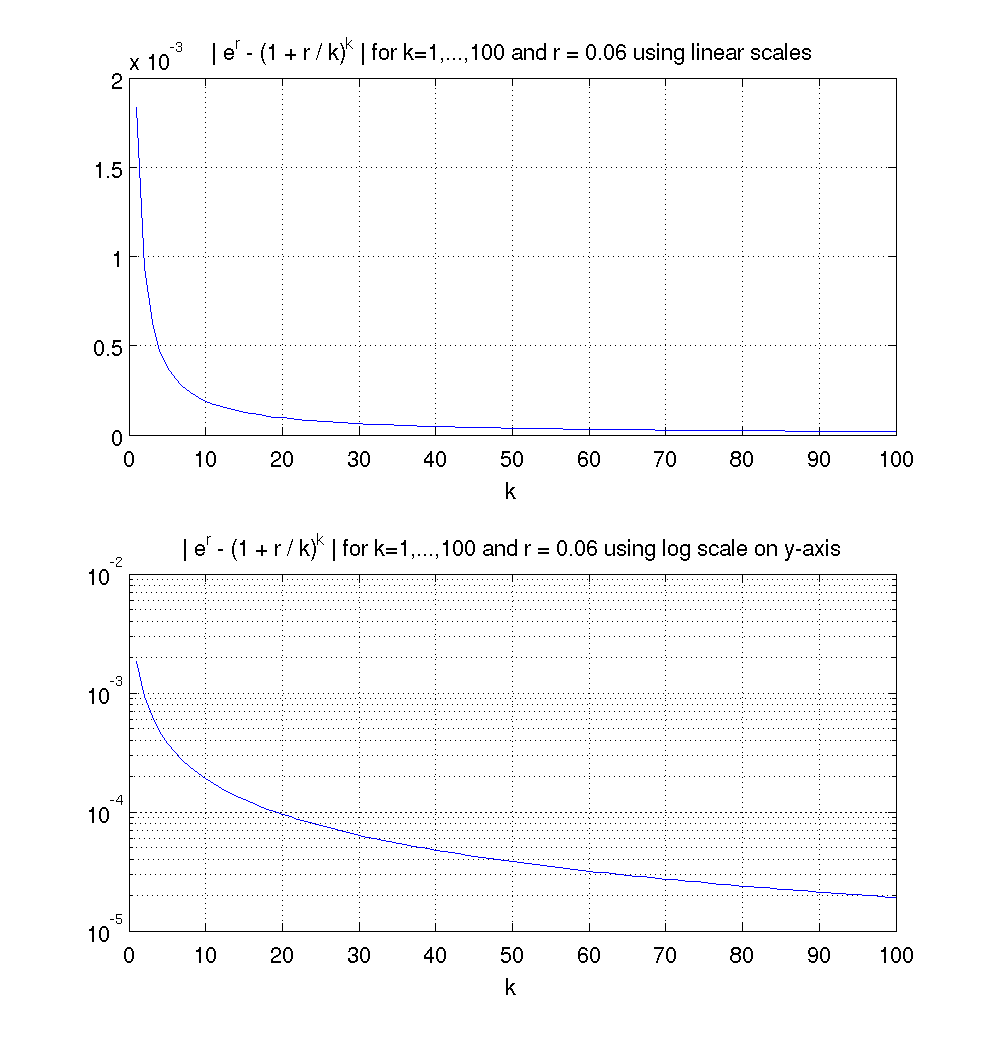
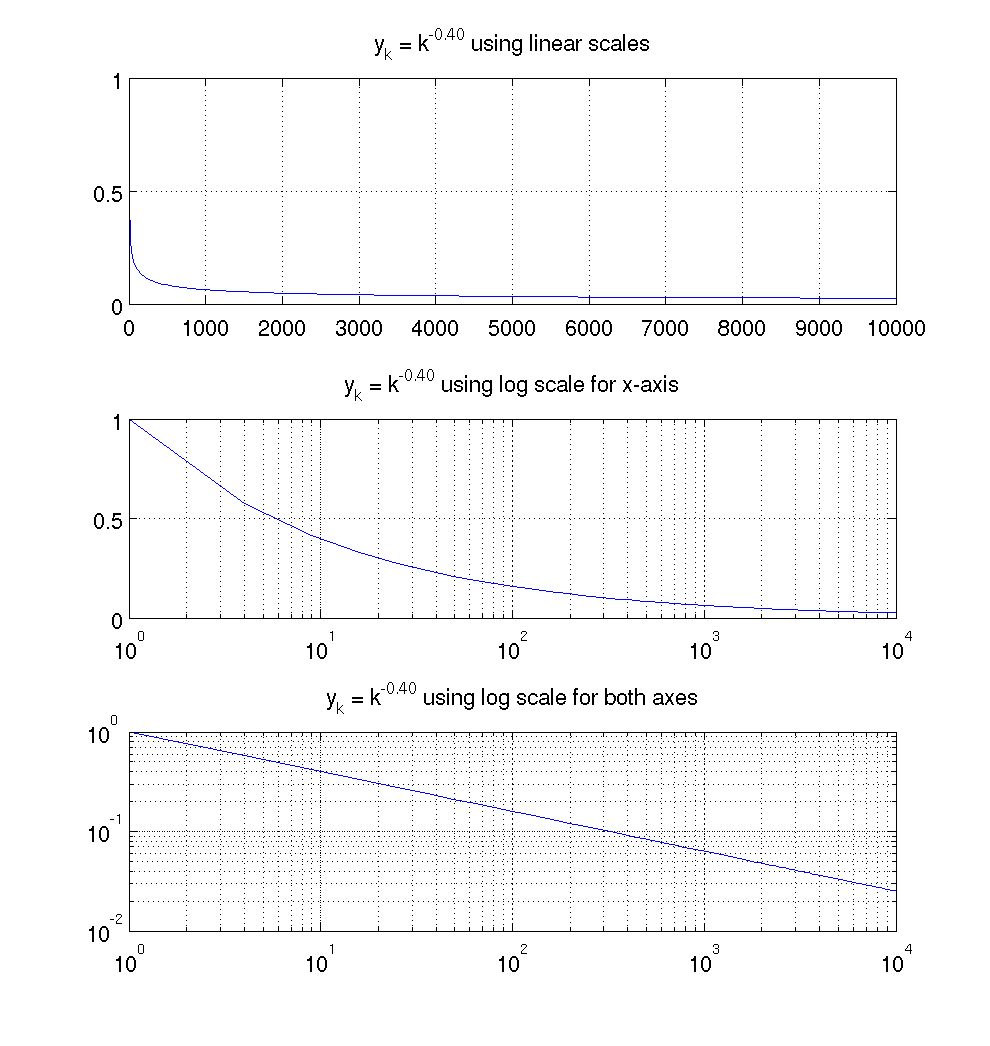
When dealing with very large values or very small positive values, it is useful to plot data or functions using a log scale. A log scale can be used either on the x-axis, or the y-axis or both.
Y-axis log scale
To create a plot with a linear scale on the x-axis and a log (base 10) scale on the y-axis you can use the function semilogy.
Define a value for r
Define a vector K of integers from 1 to 100
Define the elements of the sequence using element by element division ./ and element by element powers .^
Define the vector of magnitudes of the errors
In the first subplot use a linear scale on both axes.
In the second subplot use a log scale for the y-axis.

The MATLAB M-file used to create this plot is experr.m.
X-axis log scale
To create a plot with a linear scale on the x-axis and a log (base 10) scale on the x-axis you can use the function semilogx.
Log scale on both axes
To create a plot using a log (base 10) scale for both the x-axis and and the y-axis you can use the function loglog.
Create a vector K of the values 1, 4, 9, ..., 1002.
Create a vector Y of the values.
Create a figure with 3 subplots.
The first subplot uses a linear scale for both axes.
The second subplot uses a log scale for the x-axes.
The third subplot uses a log scale for both axes.

The MATLAB M-file used to create this plot is logplots.m.
Warnings
- What will happen if you have negative y values and try to use semilogy
or loglog?
You will get
Warning: Negative data ignored
Remember that the log of a negative number is defined in MATLAB, but the result is a complex number.
Self-test Exercise
Stirling's formula states that f(n) = log(n!) converges to g(n) = n log(n) - n as n goes to infinity.Which Matlab function gives a scaling of the axes that produces the most information about the following functions?
- f(n) and g(n) for n = 1,...,105
- (f(n)-g(n)/n for n = 1,...,105
- h(x) = x-x for x in [0, 106]
Answer:
Use the mouse to select the text between the word "Answer" and here to see the answer.
Summary
A plot with a log (base 10) scale on the x-axis (semilogx), on the y-axis (semilogy) or both axes (loglog), can be very useful when plotting very large or very small (positive) values.


