


Surface plots are an alternative to contour plots when visualising functions of two variables.
Surface plots
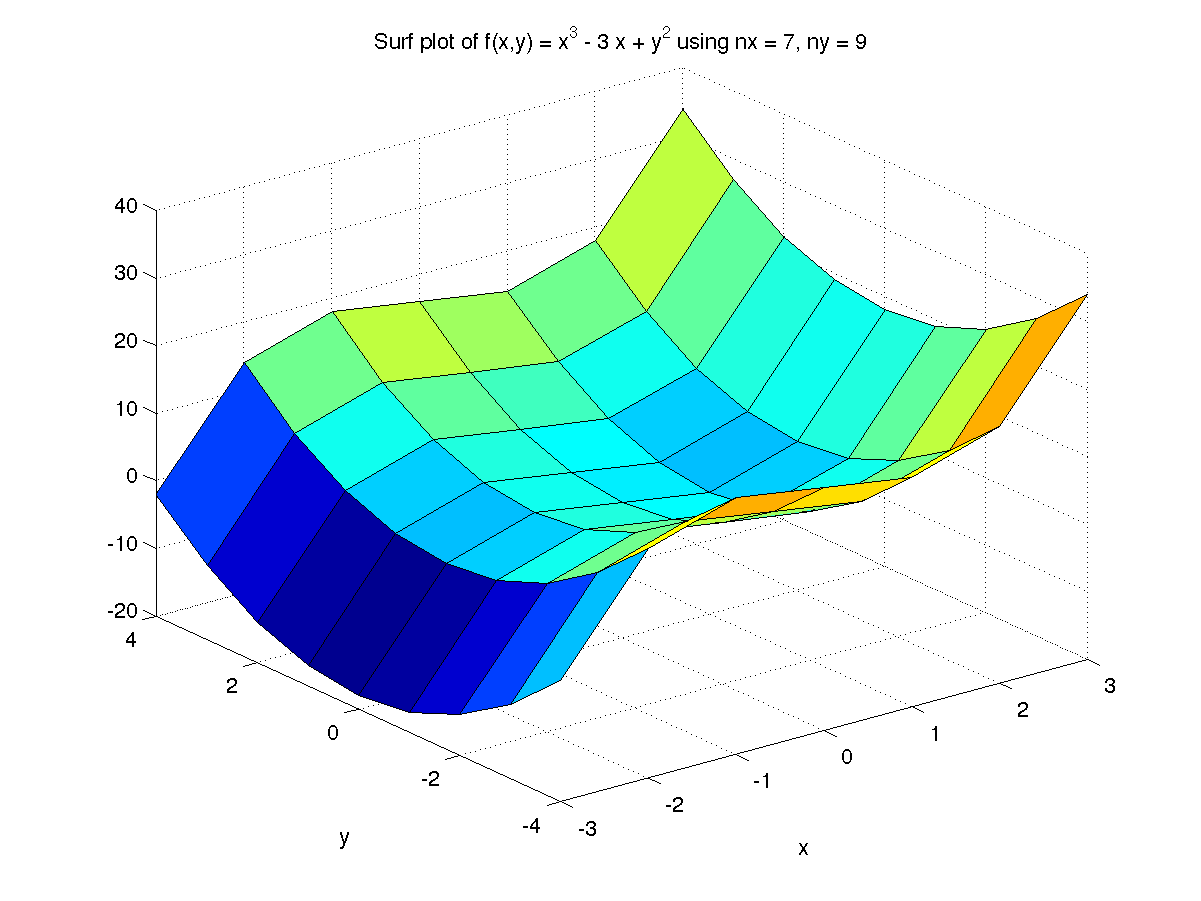
Surface plots of z = f(x, y) are produced by the MATLAB function surf. By default the height z determines the colour. As with contour plots, you must first calculate a rectangular array of function values.
Define the vector of 7 grid points for x in the interval [-3, 3]
Define the vector of 9 grid points for y in the interval [-4, 4]
Use the meshgrid function to create the 7 by 9 arrays X and Y.
Evaluate the function at each point in X and Y.
Create a surface plot.
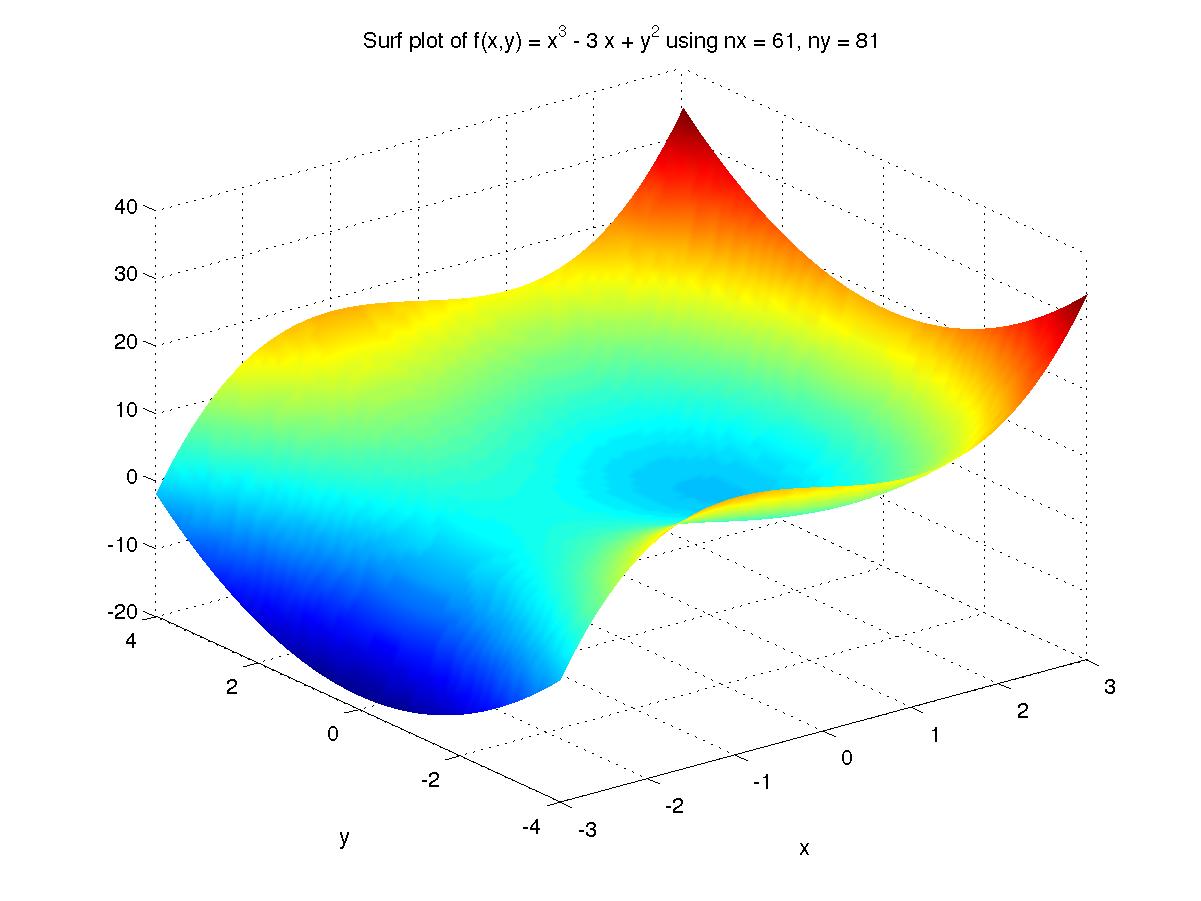
A finer 61 by 81 produces a much clearer image of the function, as below.

The MATLAB M-file used to create this plot is plt3d.m.
Interpolated shading
The plots above have grid lines which can obscure feature of the function when finer grids are used. This can be overcome using the MATLAB command shading interp which removes the grid lines and changes the way in which the colour values are calculated, giving the figure below.
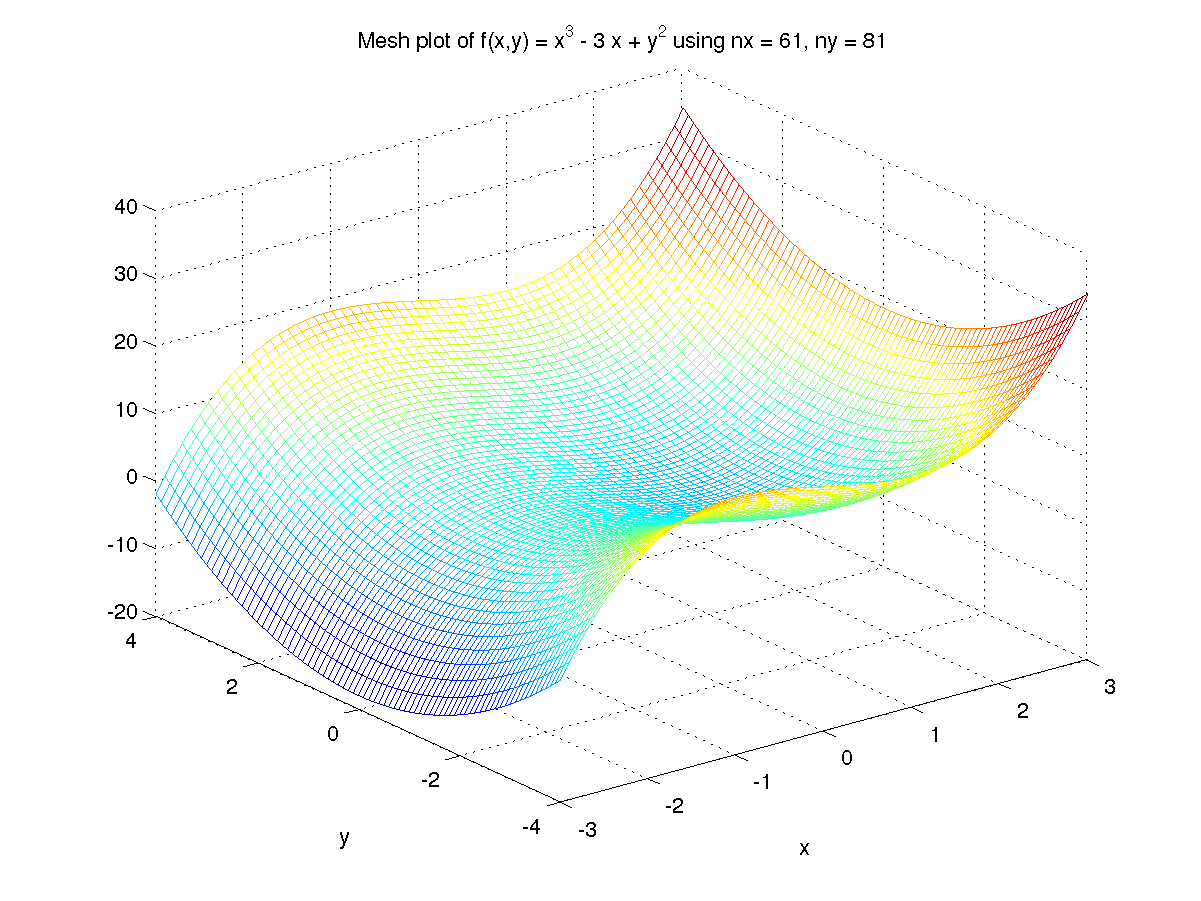
Mesh plots
A mesh plot which only has a grid of mesh lines can be created with the mesh command.
Using the data for x, y, and F created above, create a mesh plot of the function f.
Create a mesh plot of the rectangular array of data F with axes determined by the vectors x and y.
The figure window
MATLAB's figure window give you access to a number of tools to help explore and customise a figure.
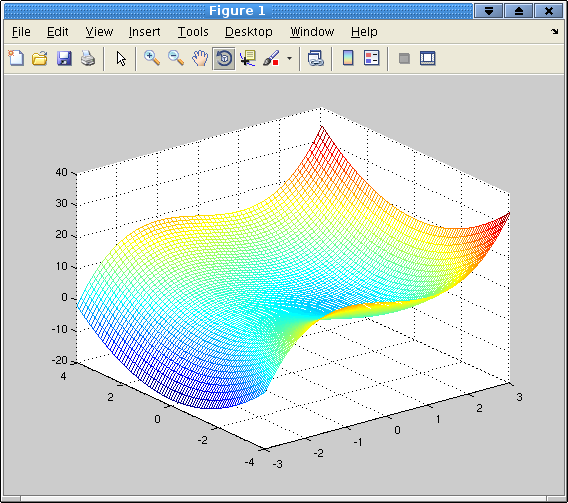
In the row of icons under the menu items the following tools are particularly useful.
- The magnifying glass with a + sign to zoom in;
- The magnifying glass with a - sign to zoom out;
- The rotating arrow to enable 3D rotation of an image (highlighted in the image above).
The zoom tools are also useful for 2D plots.
Warnings
- Virtually every feature of a figure is customisable, using MATLAB's system of handle graphics. However this can get quite complicated
Self-test Exercise
What do the following commands produce?- surfc(x, y, F)
- colorbar
- axis off
Answer:
A surface plot over a contour plot. A colorbar (colour scale), by default to the right of the plot. Makes the axes invisible.
Use the mouse to select the text between the word "Answer" and here to see the answer.
Summary
A 3-D plot of the surface z = f(x,y) using a surface or mesh plot is a good way to see the properties (minima, maxima, smoothness) of a function of two variables.