


Special plots
MATLAB has a wide variety of plotting commands enabling you to also create polar plots, histograms and many more.
Polar plots
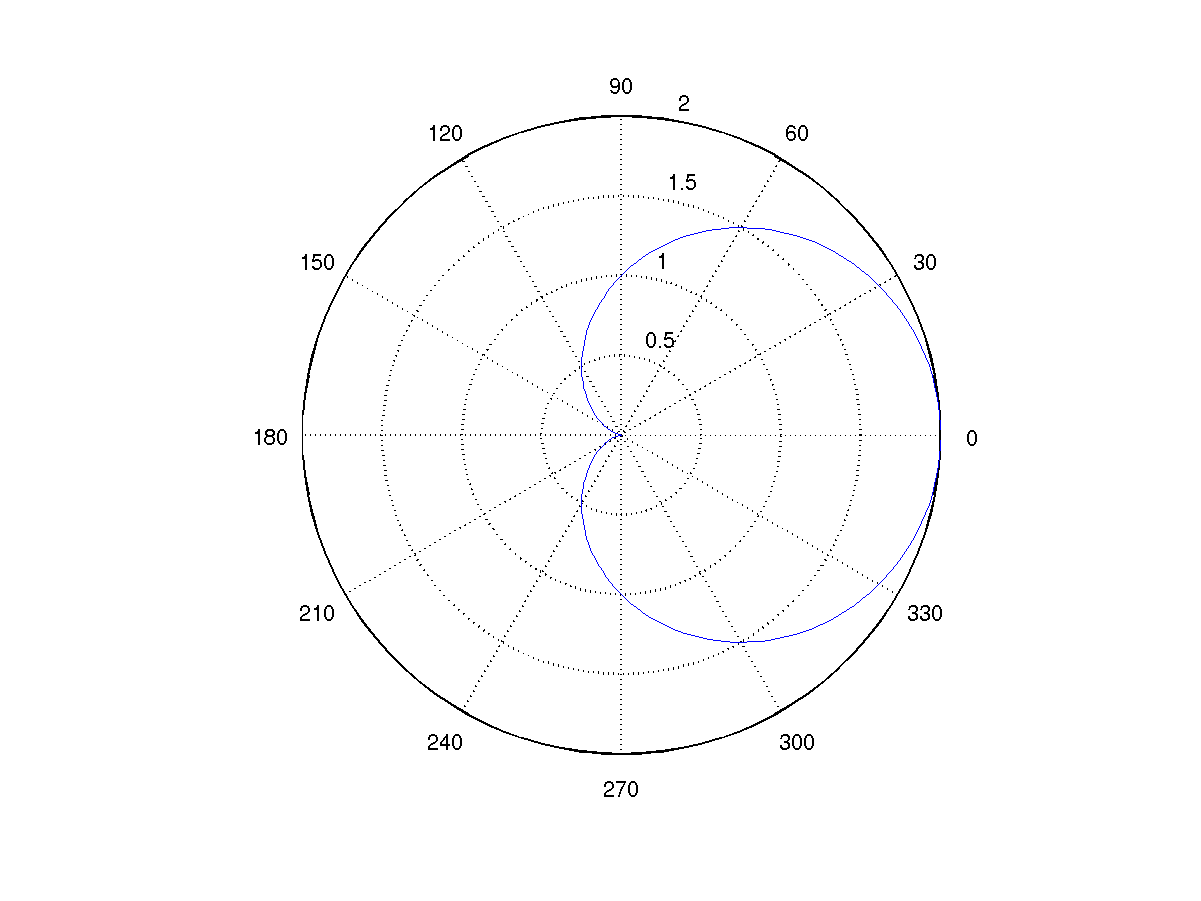
When information is given in polar coordinates, the command
polar(theta, r)
is used to make a plot of the angle theta in radians versus the radius r.
Create a vector theta of 200 equally spaced angles on [0, 2 pi].
Create the corresponding vector r.
Plot the points, producing the figure below.
Histograms
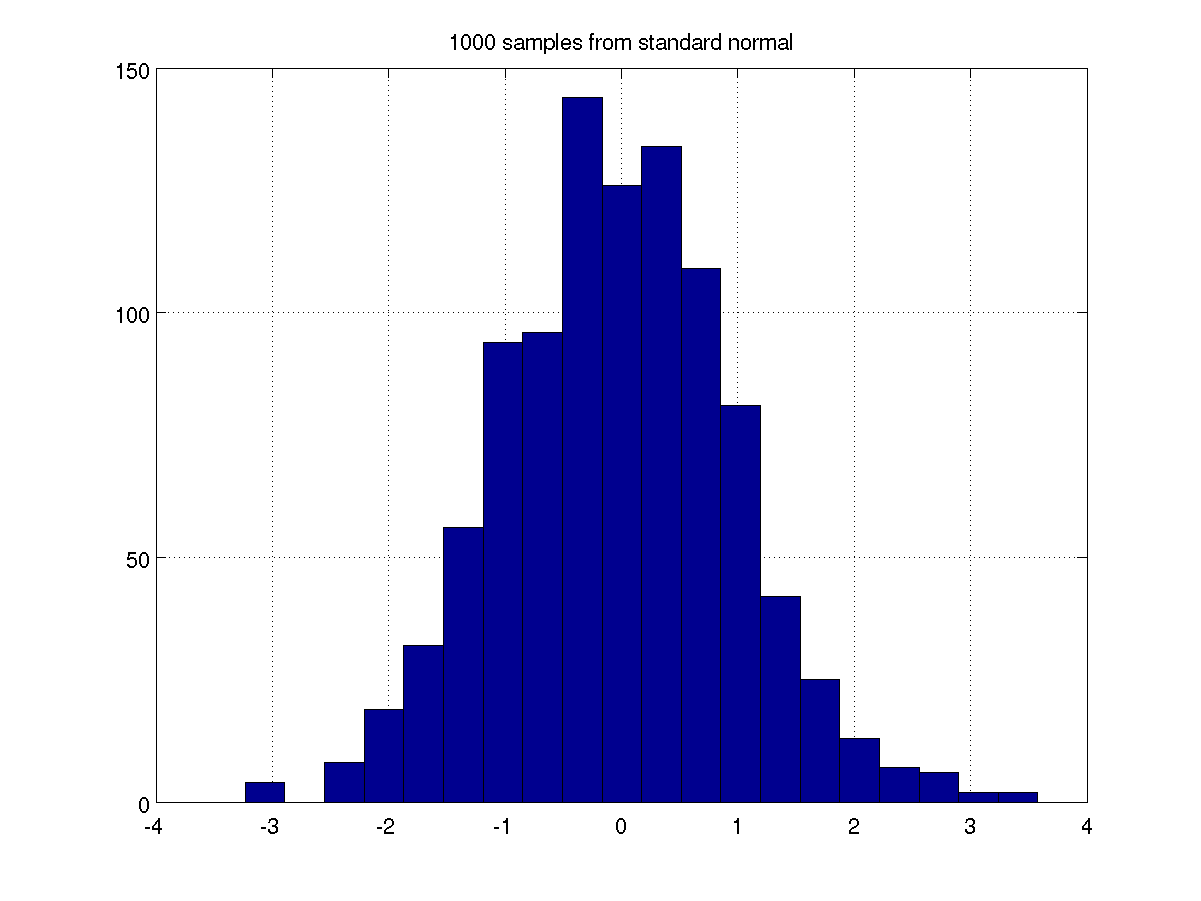
A basic tool for looking at a (large) number of values is to create a histogram, which counts the number of values that occur in each sub-interval or bin. The MATLAB command
hist(y, m)
draws a histogram of the values in the vector y using m bins.Create the vector of 1000 samples.
Create a histogram with 20 bins.
This plot also has had a title and grid added. How would you do that?
Warnings
- It is possible to customise almost any aspect of a plot using MATLAB's system of "handle graphics". However this can get quite complicated.
Self-test Exercise
Create a polar plot of the curve r = sin(3 theta).Answer:
theta = linspace(-pi, pi, 200);
r = sin(3*theta);
polar(theta, r)
Use the mouse to select the text between the word "Answer" and here to see the answer.
Summary
Polar plots are created using the polar command.
Histograms are created using the hist command.